Mapping running to presence
Edit (2015-03-28): Modifying some figures and statements as per this post
Sarah Perry recently posted a meditation on the mountain (and running and pattern and ritual and cities and understanding…) that was invigorating yet hard to know how to respond to. (Not in the sense of not knowing what to make of it, but of not knowing what to make of it.) My immediate temptation was to jot down something about the Blair loop in Williamstown, but my ability with prose is not up to conveying its comforting, boring, bucolic charm.
Anyways, in Perry’s piece, the mountain is a place that offers “jarring, visceral insight into why everything is where it is”.12 Worcester, MA, where I’m living part-time, doesn’t have mountains3 I could use for that end, but I have a cellphone with GPS, three months of runs logged in RunKeeper, and the stubbornness to muck around in GPX files and the Google Maps API. The insights produced by this method are likely to be less visceral but at least might be interesting.
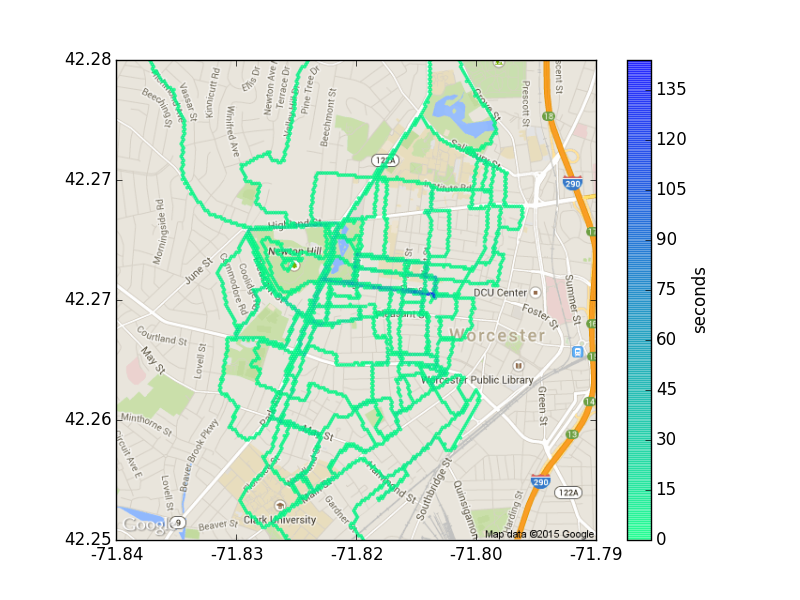
The usual way to make sense of a corpus of runs is overlap all the traces over a map. Diana Davis produced such a visualization showing her coverage of all the streets on the East Side of Providence, which is unfortunately not publicly viewable. As part of his project to walk every street in West Hartford, Gabriel Duquette made/used something similar. Here’s an example of this method, generated from my data. The line color, scale bar, and caption will be explained later.

Binning to 200×200 hexes.
An unsatisfying part of this is the degree of data reduction. A street that’s been covered tens of times can show up similarly to one that’s only been visited once. Simultaneously, the representation can leave too much specificity intact. When looking at these, I feel the distracting inclination to deconvolve the tangle of lines back into individual runs.4

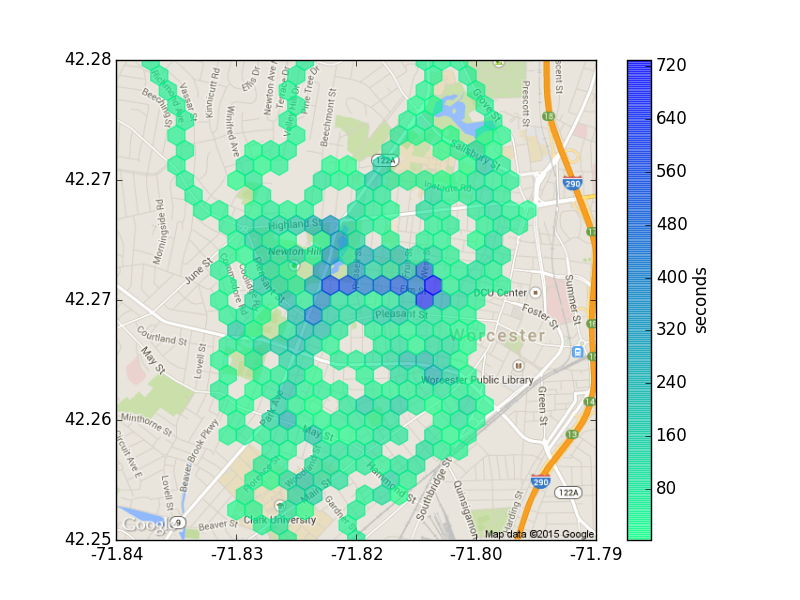
Binning to 28×28 hexes.
As an experiment, I tried using a hexagonal 2-d histogram to visualize where my time running is spent. An extremely cursory search didn’t turn up anyone else who’s tried this, so I hacked together an implementation, using Python to glue all the pieces together.5 The earlier linear figure uses the same code but with an excessive number of bins.
With the present amount of data, I can’t claim much new insight. But the holes, the areas I haven’t been surrounded by areas I have, take on new significance. Looking at the traces, it’s easy to explain them away by as “I didn’t go there because I was going here instead”. But on the histogram, there’s no explanation for my absence from them in contrast with my presence elsewhere. And remedying this, if I choose to do so, is easier. The challenge is reframed from choosing a different route from one I’ve taken before to just spending a moment somewhere I haven’t been before regardless of how I get there.
It’s only a bit worrying that this new perspective is illusory. Running all the streets is possible; visiting all the hexes at an arbitrary fineness of binning is not.
I really should excerpt that entire paragraph, but presenting it without the narrative climb and descent would be entirely against its spirit.↩
There’s also a similar perspective in Scott Alexander’s Meditation on Moloch:
↩I will now jump from boring game theory stuff to what might be the closest thing to a mystical experience I’ve ever had.
Like all good mystical experiences, it happened in Vegas. I was standing on top of one of their many tall buildings, looking down at the city below, all lit up in the dark. […]
Las Vegas doesn’t exist because of some decision to hedonically optimize civilization, it exists because of a quirk in dopaminergic reward circuits, plus the microstructure of an uneven regulatory environment, plus Schelling points. A rational central planner with a god’s-eye-view, contemplating these facts, might have thought “Hm, dopaminergic reward circuits have a quirk where certain tasks with slightly negative risk-benefit ratios get an emotional valence associated with slightly positive risk-benefit ratios, let’s see if we can educate people to beware of that.” People within the system, following the incentives created by these facts, think: “Let’s build a forty-story-high indoor replica of ancient Rome full of albino tigers in the middle of the desert, and so become slightly richer than people who didn’t!”
Just as the course of a river is latent in a terrain even before the first rain falls on it – so the existence of Caesar’s Palace was latent in neurobiology, economics, and regulatory regimes even before it existed. The entrepreneur who built it was just filling in the ghostly lines with real concrete.
It does claim to have seven hills, as well as the Heart of the Commonwealth.↩
One should probably be aware of the security implications when making such figures. It seems reasonable that in the presence of a determined adversary, posting these is the equivalent of putting up the complete GPS records.↩
It’s fortunate that Google Maps uses a cylindrical projection, since otherwise I’d have needed to do a lot more trigonometry to interconvert between map coordinates and lat-lon.I was mistaken on this point.↩