Access statistics
Except where stated otherwise, only hits that are not suspected to originate from bots are displayed.
Temporal patterns
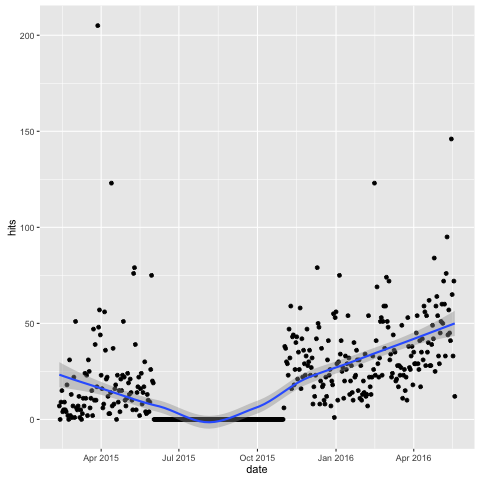
Hits by date.
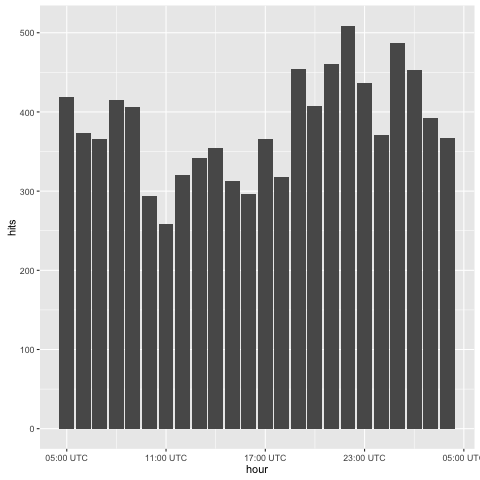
Hits by time.
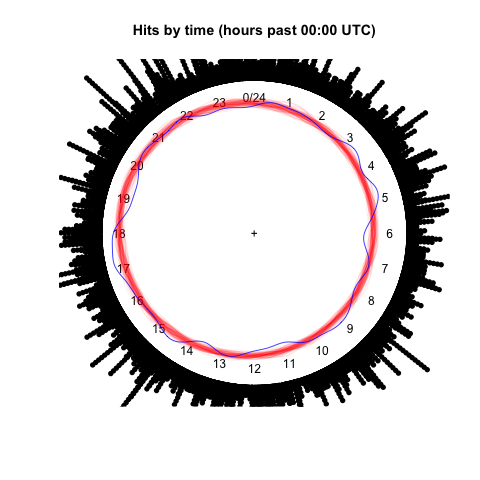
Hits by time, von Mises model fit.
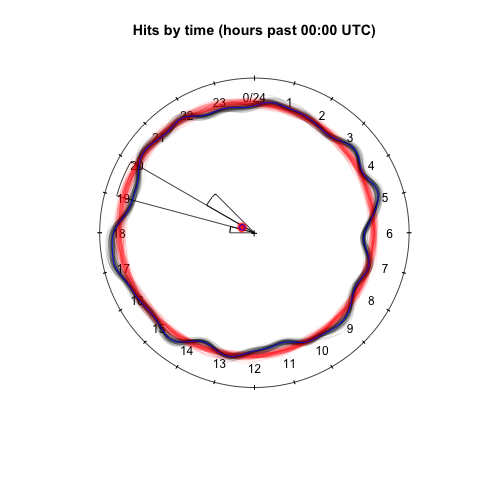
Hits by time, von Mises model fit with bootstrap to characterize model uncertainty.
Remote IP uniqueness
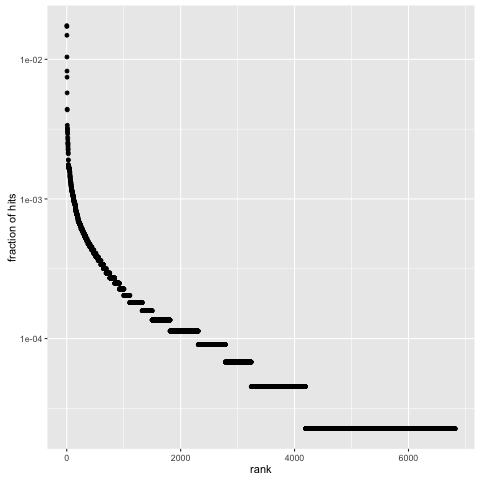
Rank-abundance plot for all hits (including suspected bots) by IP.
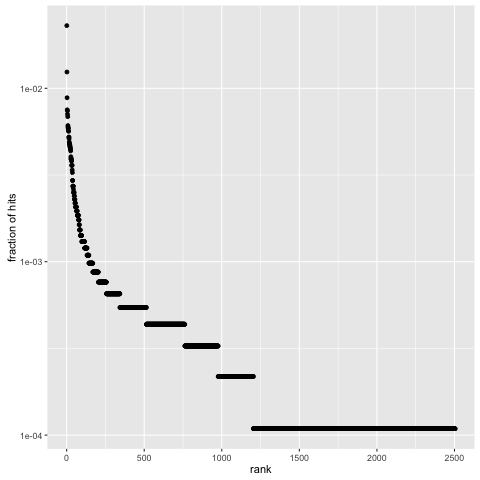
Rank-abundance plot for hits by IP.
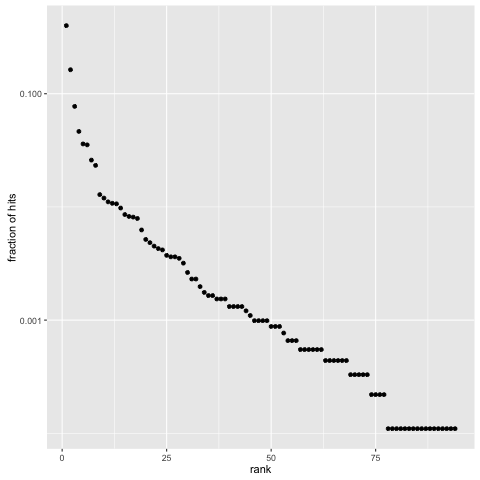
Rank-abundance plot for hits by country.
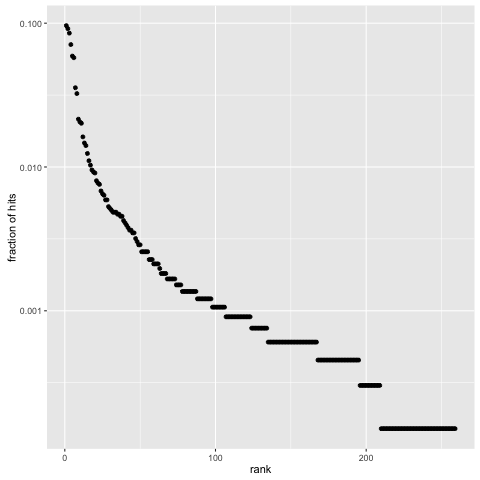
Rank-abundance plot for hits by region.